M2 as of 06/19/2023

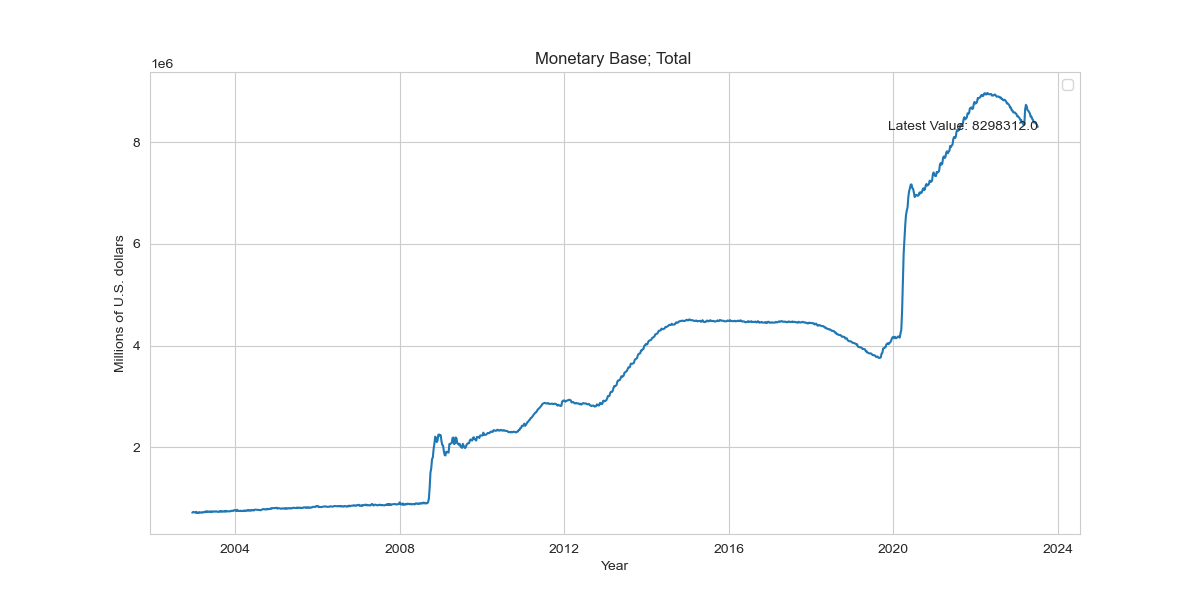
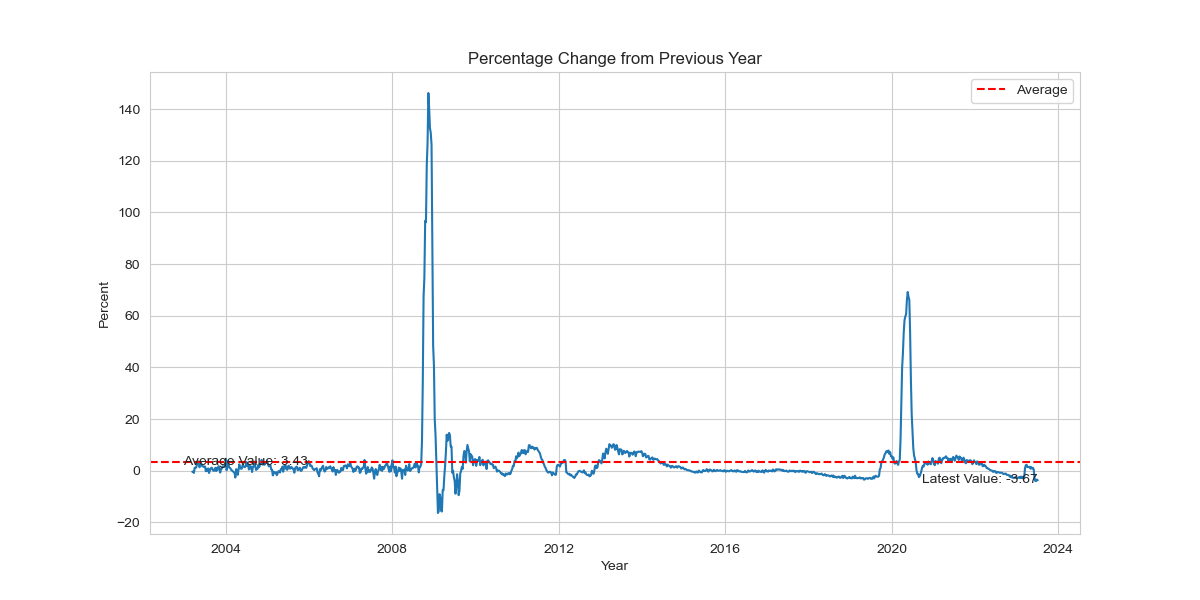
The following charts present data on M2 and the corresponding percentage changes from the previous year. The first chart highlights that M2 experienced a significant 25% increase during the pandemic period. However, it has since started to decline, currently showing a decrease of -4.63% compared to the previous year.

M2 refers to a widely-used economic indicator that measures the money supply within an economy. It represents a broader definition of money compared to the narrower monetary base. M2 includes not only physical currency and coins in circulation but also various types of deposits held by individuals, businesses, and other non-bank entities.

The components of M2 typically include:

  1. Currency in circulation: This represents physical money, such as coins and banknotes, that is in the hands of the public.
  2. Demand deposits: These are funds held in checking accounts, which can be easily accessed and used for transactions.
  3. Savings deposits: These include savings accounts and money market accounts, where individuals and businesses can hold their money and earn interest.
  4. Time deposits: These are fixed-term deposits, such as certificates of deposit (CDs), where the funds are held for a specified period, typically with higher interest rates than savings accounts.
  5. Retail money market funds: These are mutual funds that invest in short-term debt securities and provide individuals with an option to invest their money in relatively safe and liquid instruments.

M2 is considered an important measure of the overall money supply and is closely monitored by economists, policymakers, and investors. Changes in M2 can provide insights into the level of liquidity in the economy and the potential for inflationary pressures.

During periods of economic growth, M2 tends to increase as individuals and businesses have higher demand for money to support their transactions and investment activities. Conversely, during economic downturns, M2 growth may slow down or even contract as individuals and businesses reduce their spending and increase their savings.

It is worth noting that M2 growth can also be influenced by monetary policy actions undertaken by central banks. For example, when a central bank engages in expansionary monetary policy, such as lowering interest rates or engaging in quantitative easing, it can lead to an increase in the money supply and contribute to M2 growth.

Overall, M2 provides a comprehensive view of the money supply in an economy, encompassing various forms of money and deposits. By tracking changes in M2, economists and policymakers can gain insights into the state of the economy and make informed decisions regarding monetary policy and financial stability.

Monetary Base: Total as of 07/05/2023

The chart below depicts the monetary base as of 06/19/2023. It reveals that the monetary base experienced a notable increase, surpassing the 8 trillion dollar mark after starting at 4 trillion dollars. However, it subsequently decreased to approximately 8.3 trillion dollars.

The monetary base represents the total amount of money created by a central bank and includes currency in circulation and reserves held by commercial banks. It is an important measure of the money supply, but there are other measures such as M1, M2, and M3 that capture different components of the money supply. The monetary base allows the central bank to influence the money supply and economic activity through various mechanisms, such as buying government bonds to increase reserves and stimulate lending. Additionally, the monetary base is a key component of the central bank’s balance sheet, which includes its assets (monetary base, gold, foreign reserves) and liabilities (currency in circulation, reserves, government bonds). Understanding the concept of the monetary base is crucial for comprehending the central bank’s role in shaping the economy.

The Fed Fund Rate and Prime Rate as of 06-19-2023

During the pandemic, both the Fed funds rate and prime rate experienced a significant decline and remained at historically low levels for nearly two years. However, they have recently begun to rise and have now reached levels comparable to those before the financial crisis.

The federal funds rate and the prime rate are two important interest rates that affect the economy. The federal funds rate is the interest rate that banks charge each other for overnight loans. The prime rate is the interest rate that banks charge their most creditworthy customers for loans.

The federal funds rate is set by the Federal Open Market Committee (FOMC), which is the monetary policy committee of the Federal Reserve. The FOMC meets eight times a year to set the federal funds rate target. The target federal funds rate is the rate that the FOMC wants banks to charge each other for overnight loans.

The prime rate is not set by the Federal Reserve. It is set by individual banks, but it is typically about 3 percentage points higher than the federal funds rate target. This means that when the FOMC raises the federal funds rate target, the prime rate also goes up.

The federal funds rate and the prime rate are important because they affect the cost of borrowing money. When the federal funds rate goes up, the cost of borrowing money goes up for everyone, including businesses and consumers. This can make it more difficult for businesses to invest and for consumers to buy homes and cars.

The federal funds rate and the prime rate also affect the stock market. When the federal funds rate goes up, it can make investors nervous about the future of the economy. This can lead to a sell-off in the stock market.

The federal funds rate and the prime rate are important tools that the Federal Reserve can use to influence the economy. By raising or lowering the federal funds rate, the Fed can make it more or less expensive to borrow money. This can help to cool down the economy if inflation is too high, or to stimulate the economy if growth is too slow.

Here is a table that summarizes the key differences between the federal funds rate and the prime rate:

CharacteristicFederal Funds RatePrime Rate
Who sets itFederal Open Market Committee (FOMC)Individual banks
How often it is setEight times a yearNot set by the Fed
Typical levelAbout 2 percentage points below the federal funds rate targetAbout 3 percentage points above the federal funds rate target
Effect on the cost of borrowing moneyMakes it more expensive to borrow moneyMakes it more expensive to borrow money
Effect on the stock marketCan make investors nervous about the future of the economyCan lead to a sell-off in the stock market

Producer Price Indexes as May 2023.

The Producer Price Index (PPI) and Core PPI spiked during the pandemic, but have since declined rapidly. As of May 2023, the Core PPI is 2.85% and the PPI is 1.22%, which are both close to their historical average values.

During the pandemic, both the Producer Price Index (PPI) and the Core PPI experienced significant spikes followed by a rapid decline. Currently, the Core PPI stands at 2.85%, while the PPI is at 1.22%. These values are close to the historical average values, suggesting a notable easing of inflation pressures stemming from the supply chain.

The spikes observed in the PPI and Core PPI during the pandemic were primarily driven by disruptions in global supply chains, shortages of raw materials, and increased production costs. However, as the global economy recovers and supply chains stabilize, the inflationary pressures have started to subside.

The current levels of the Core PPI and PPI, which are close to historical averages, indicate a return to more normalized price dynamics. This implies that the temporary shocks and imbalances in the supply chain are gradually being resolved.

The easing of inflation pressures from the supply chain is a positive development for businesses and consumers. It suggests that the extreme cost pressures experienced during the pandemic are likely to subside, leading to more stable input costs and pricing conditions. This can provide relief to businesses and allow them to plan their operations with greater certainty.

Moreover, the moderation in inflationary pressures from the supply chain is also beneficial for consumers. It indicates that the sharp price increases witnessed in certain sectors, such as food and energy, may start to stabilize. This can help alleviate the burden on households’ budgets and improve overall economic stability.

The Producer Price Index (PPI) is a measure of average changes in the prices received by domestic producers for their output. It provides valuable information about inflationary pressures at the producer level and serves as an indicator of trends in input costs for businesses. Two important components of the PPI are the Producer Price Index by Commodity: Final Demand (PPIFIS) and the Producer Price Index by Commodity: Final Demand Less Foods and Energy (PPIFES).

  1. Producer Price Index by Commodity: Final Demand (PPIFIS):
    The PPIFIS measures the average changes in prices received by domestic producers for their final goods and services. It includes prices for goods, services, and construction sold for personal consumption, capital investment, government, and export purposes. This index provides insights into overall price trends in the economy and is widely used by businesses, policymakers, and economists to monitor inflationary pressures and make informed decisions.
  2. Producer Price Index by Commodity: Final Demand Less Foods and Energy (PPIFES):
    The PPIFES is a variant of the PPIFIS that excludes the volatile prices of food and energy products. By excluding these prices, which are known to be subject to significant short-term fluctuations, the PPIFES aims to provide a more stable measure of underlying inflation trends. This index is useful for analyzing core inflation, which helps identify long-term inflationary pressures without the influence of temporary price fluctuations in food and energy sectors.

Both the PPIFIS and PPIFES are important economic indicators that provide valuable insights into inflationary pressures and price dynamics at the producer level. They help policymakers, businesses, and economists gauge the health of the economy, monitor changes in input costs, and make informed decisions related to pricing strategies, monetary policy, and economic forecasting.

Analyzing the percentage changes in these indices over time can reveal trends in producer prices, inflationary pressures, and the impact of specific sectors such as food and energy on overall price dynamics. By calculating and visualizing the percentage changes from the previous year, as demonstrated in the code snippet you provided, it becomes easier to identify periods of significant price increases or decreases and understand the relative contributions of different sectors to overall inflation.

Understanding and monitoring these indices are crucial for policymakers, businesses, and investors to assess economic conditions, anticipate changes in input costs, and make informed decisions related to pricing, production, and investment strategies.